Monday 19 May 2014

WEEK 12

Date: 27 April 2014

Title: Prepare the proposal slide show for Engineering Design.

Objective: For presentation In Engineering Design class.

Content/Procedure:

  1. We were using Microsoft Power Point for our presentation.
  2. Slide show Automatic Light Switch with fire Alarm using Thermistor.


Result: We hope we can do the best for our presentation.

WEEK 11

Date : 19 April 2014

Title: Project Proposal

Objective: Draft Project Proposal

Content/Procedure:
For this week,We need start do the project proposal for our project.Before submitted the project proposal, firstly we must do project proposal draft based on the guideline and format that have been given below;

  1.  Title Page
  2.  Table of Contents
  3. Abstracts
  4.  Problem Statement
  5. Goal & Objectives
  6. Scope & Limitation
  7.  Literature Review
  8.  Methodology
  9. Result
  10. Costing
  11. Gantt Chart
  12.  Conclusion
  13.  References


Result: With the format we know the guideline and what to do for our proposal and complete this proposal then submit to our Lecturer's Class Engineering Design, Sir Ahmad Zaki bin Abdul Karim.

Conclusion: We have succesful submit our project proposal within the week.

WEEK 10

Date: 14 April 2014 ( Week 10)

Title: Project Budget Estimation

Objective: With this budget estimation, we can examine on how much our project will costing and where we spent our money to buy all the components and the equipments.

Content/Procedure: We have listed the estimation cost for our project.


Result: We obtain and knew the info for our project estimation cost and we need to prepare all the modal to buy all the component.

Conclusion: The cost estimation is very important to every project because it can save money and time.

Sunday 18 May 2014

WEEK 9

Date : 7 April 2014

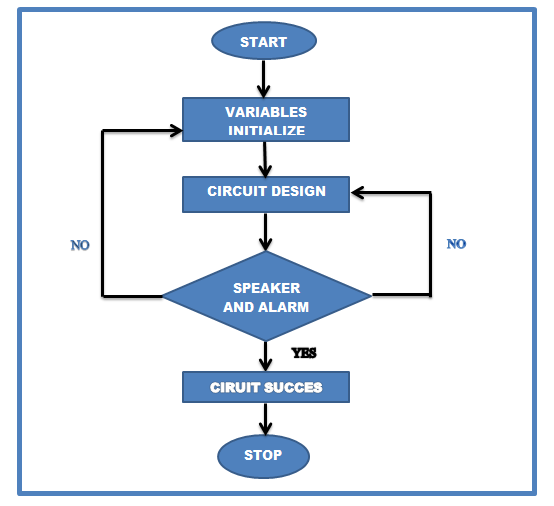
Title : Flow Chart & Gannt Chart Of the Project

Objective :

  • To identify the flow of project operations.
  • to follow the guideline date that we have made.

Content / Producer : Figure below were our Flow Chart & Gannt Chart for our the Project

Result:
  1. Figure below show our Flow Chart:

Gantt Chart:


BIL
TASK NAME
DURATION
START
FINISH


1
Start
0 days
Mon-3-Feb-14
Mon-3-Feb-14
2
Find the supervisor
8 days
Mon-10-Feb-14
Mon -17-Feb-14
3
Find the tittle
10 days
Tue-18-Feb-14
Thu-27-Feb-14
4
Discuss the project
15 days
Fri-28-Feb-14
Fri-14-March-14
5
Research from internet
18 days
Mon-17-March-14
Thu-3-April-14
6
Research from advisor
15 days
Fri-4-April-14
Fri-18-April-14
7
Research from book
18 days
Mon-21-April-14
Thu-8-May-14
8
Find the best components
20 days
Fri-9-May-14
Wed-28-May-14
9
Find the best place to find the components
20 days
Thu-29-May-14
Thu-17-June-14
10
Buying the components
30 days
Wed-18-June-14
Tue-17-July-14
11
Component test
18 days
Fri-18-July-14
Mon-4-Aug-14
12
Planning the project step by step
16 days
Tue-5-Aug-14
Wed-20-Aug-14
13
assemble all the component
18 days
Thu-21-Aug-14
Mon-8-Sep-14
14
Construct the circuit
18 days
Tue-9-Sep-14
Fri-26-Sep-14
15
Install circuit in component
18 days
Mon29-Sep-14
Tue-16-Oct-14
16
Testing the device
11 days
Fri-17-Oct-14
M0n-27-Oct-14
17
Analysis
10 days
Tue-28-Oct-14
Thu-6-Nov-14
18
Project complete
15 days
Mon-10-Nov-14
Mon-24-Nov-14
19
Preparation power point presentation
7 days
Wed-26-Nov-14
Wed-3-Dec-14
20
Presentation the project
1 day
Mon-8-Dec-14
Tue-9-Dec-14
21
Finish
1 day
Mon-15-Dec-14
Tue-16-Dec-14Result: We understood on how to take care of this device. 


Conclusion: After produce the Flow Chart , our operation of project become easier. While the Gantt chart will guide us complete the project according to our time planning.