Title : Flow Chart & Gannt Chart Of the Project
Objective :
- To identify the flow of project operations.
- to follow the guideline date that we have made.
Content / Producer : Figure below were our Flow Chart & Gannt Chart for our the Project
Result:
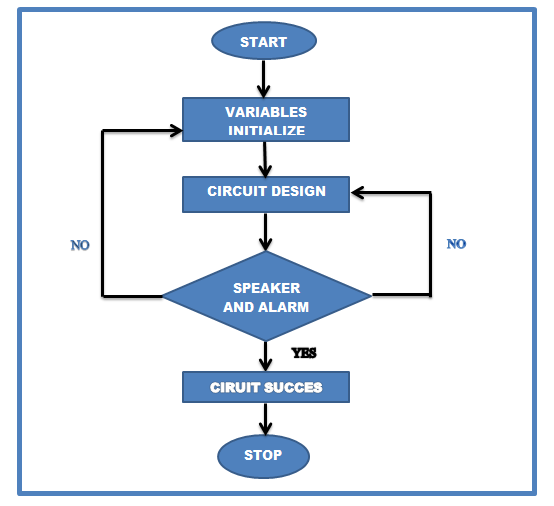
- Figure below show our Flow Chart:
|
BIL
|
TASK NAME
|
DURATION
|
START
|
FINISH
|
|
1
|
Start
|
0 days
|
Mon-3-Feb-14
|
Mon-3-Feb-14
|
|
2
|
Find the supervisor
|
8 days
|
Mon-10-Feb-14
|
Mon -17-Feb-14
|
|
3
|
Find the tittle
|
10 days
|
Tue-18-Feb-14
|
Thu-27-Feb-14
|
|
4
|
Discuss the project
|
15 days
|
Fri-28-Feb-14
|
Fri-14-March-14
|
|
5
|
Research from internet
|
18 days
|
Mon-17-March-14
|
Thu-3-April-14
|
|
6
|
Research from advisor
|
15 days
|
Fri-4-April-14
|
Fri-18-April-14
|
|
7
|
Research from book
|
18 days
|
Mon-21-April-14
|
Thu-8-May-14
|
|
8
|
Find the best components
|
20 days
|
Fri-9-May-14
|
Wed-28-May-14
|
|
9
|
Find the best place to find the
components
|
20 days
|
Thu-29-May-14
|
Thu-17-June-14
|
|
10
|
Buying the components
|
30 days
|
Wed-18-June-14
|
Tue-17-July-14
|
|
11
|
Component test
|
18 days
|
Fri-18-July-14
|
Mon-4-Aug-14
|
|
12
|
Planning the project step by step
|
16 days
|
Tue-5-Aug-14
|
Wed-20-Aug-14
|
|
13
|
assemble all the component
|
18 days
|
Thu-21-Aug-14
|
Mon-8-Sep-14
|
|
14
|
Construct the circuit
|
18 days
|
Tue-9-Sep-14
|
Fri-26-Sep-14
|
|
15
|
Install circuit in component
|
18 days
|
Mon29-Sep-14
|
Tue-16-Oct-14
|
|
16
|
Testing the device
|
11 days
|
Fri-17-Oct-14
|
M0n-27-Oct-14
|
|
17
|
Analysis
|
10 days
|
Tue-28-Oct-14
|
Thu-6-Nov-14
|
|
18
|
Project complete
|
15 days
|
Mon-10-Nov-14
|
Mon-24-Nov-14
|
|
19
|
Preparation power point
presentation
|
7 days
|
Wed-26-Nov-14
|
Wed-3-Dec-14
|
|
20
|
Presentation the project
|
1 day
|
Mon-8-Dec-14
|
Tue-9-Dec-14
|
|
21
|
Finish
|
1 day
|
Mon-15-Dec-14
|
Tue-16-Dec-14Result: We understood on how to take care of this device.
|
Conclusion: After produce the Flow Chart , our operation of project become easier. While the Gantt chart will guide us complete the project according to our time planning.
No comments:
Post a Comment